trading

trading

Tuesday, 10 January 2012

3-long term bullish patterns in play

inverse H&S pattern

triangle-breakout

pitchfork uptrend in formation
                                                     

                                                             short-term pattern
                                                    C&H pattern


Now - The market needs to follow through soon and trade above last week's highs on some convincing volume. After that is testing and taking out the October highs to help provide positive price follow through of the current bullish technical patterns in place.


Watch for - More weakness and consolidation again this coming week,  especially into January options expiration week, and we could see yet another swing reversal all the way down to the 50dma.


for the week ahead, January 9th to 13th
               

http://www.youtube.com/watch?v=VbhsYC4gKy4


Sunday, 18 December 2011


                                   http://www.youtube.com/v/S6N05To9Dy8


Friday, 16 December 2011

Somebody said that it couldn't be done,
But he with a chuckle replied
That "maybe it couldn't," but he would be one
Who wouldn't say so till he'd tried.
So he buckled right in with the trace of a grin
on his face. If he worried he hid it.
He started to sing as he tackled the thing That couldn't be done, and he did it.
Somebody scoffed: "Oh, you'll never do that;
At least no one ever has done it";
But he took off his coat and he took off his hat,
And the first thing we knew he'd begun it.
With a lift of his chin and a bit of a grin,
Without any doubting or quiddit,
He started to sing as he tackled the thing
That couldn't be done, and he did it.
There are thousands to tell you it cannot be done,
There are thousands to prophesy failure;
There are thousands to point out to you one by one,
The dangers that wait to assail you.
But just buckle in with a bit of a grin,
Just take off your coat and go to it;
Just start to sing as you tackle the thing
That "cannot be done," and you'll do it.
by Edgar A. Guest

Thursday, 15 December 2011

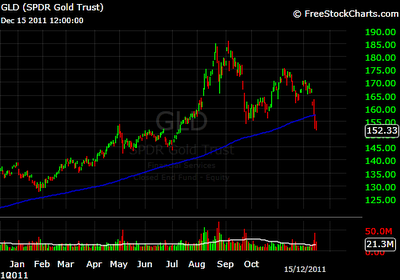
Gold ETF GLD breaks down through its 200-day moving average for the first time in 3 years


                                                     click on the chart to enlarge it

Is GLD's break through its 200-day moving average a sign that central banks may be too slow to print money (QE)?

monthly view